Info
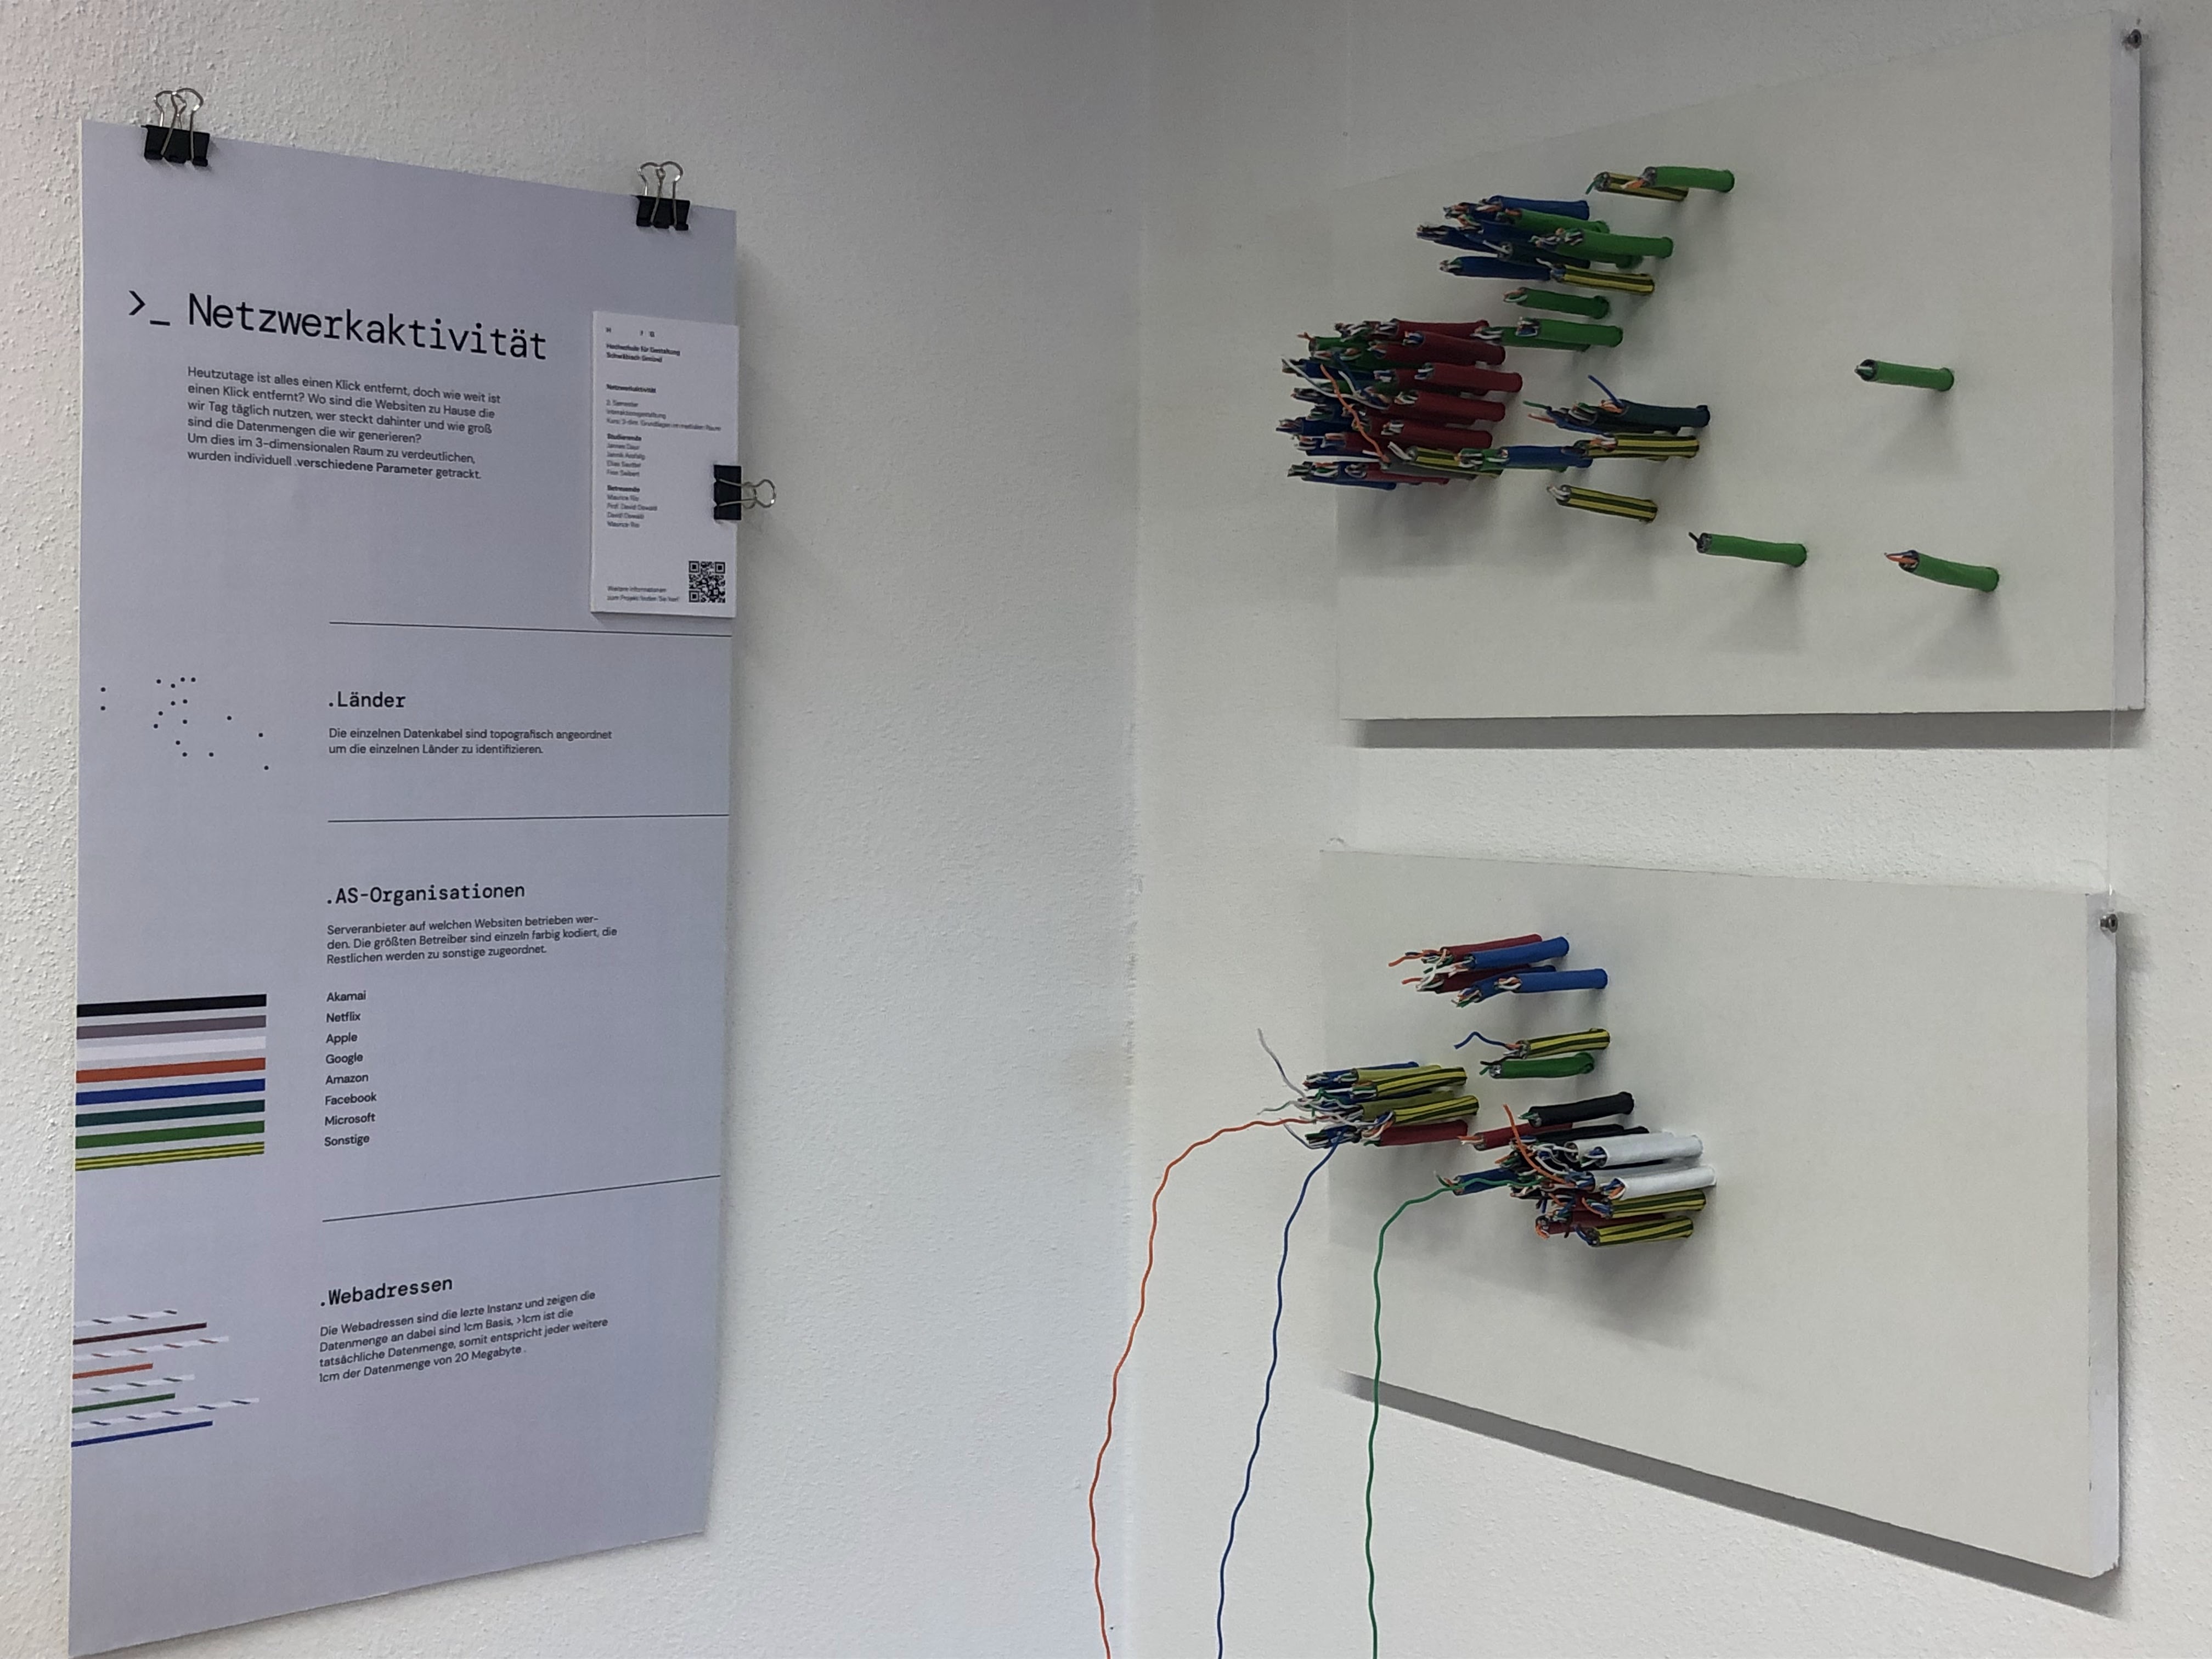
This project used Wireshark and a Raspberry Pi proxy server to visualize network activity through Endpoint Analysis. The final design featured an 8-strand network cable on a board, with distinct AS-organizations represented by colored tapes, and cable length indicating data volume.
Finding Topics
To begin, we selected which data we could visualize from 4 network activity topics. We picked from the following topics:- Packet Analysis- Browser history analysis / comparison- Digital data profile in social media- Endpoint Analysis
Endpoint Analysis
We decided to use the endpoint analysis, which includes several parameters, the server names, i.e. website name and IP address, as well as the data volumes in megabytes, the geolocation as country and city names, AS organization or server provider, and finally the hops, i.e. the jumps across different nodes. The last parameter had to be deleted because it was too time-consuming to record.
Survey Method
The recording of the data works via the data collection program Wireshark. For this purpose, all traffic is run through Rasperry-Pi via proxy server. The data is archived in a CSV table, from which we can easily read the data.
Draft
The final design we came up with was a cable that is divided into several subgroups and thus can display all the parameters. It consists of an 8-strand network cable divided into groups by insulating tapes and shrink tubes, but this was difficult to read. To improve readability, we arranged the cables topographically on a board, and the cables themselves are wrapped with different colored insulating tapes representing the different AS organizations. The length of one of the 8-strand cables symbolizes the data volume of a website.